Používání analytiky
Přehled sekce Analytika
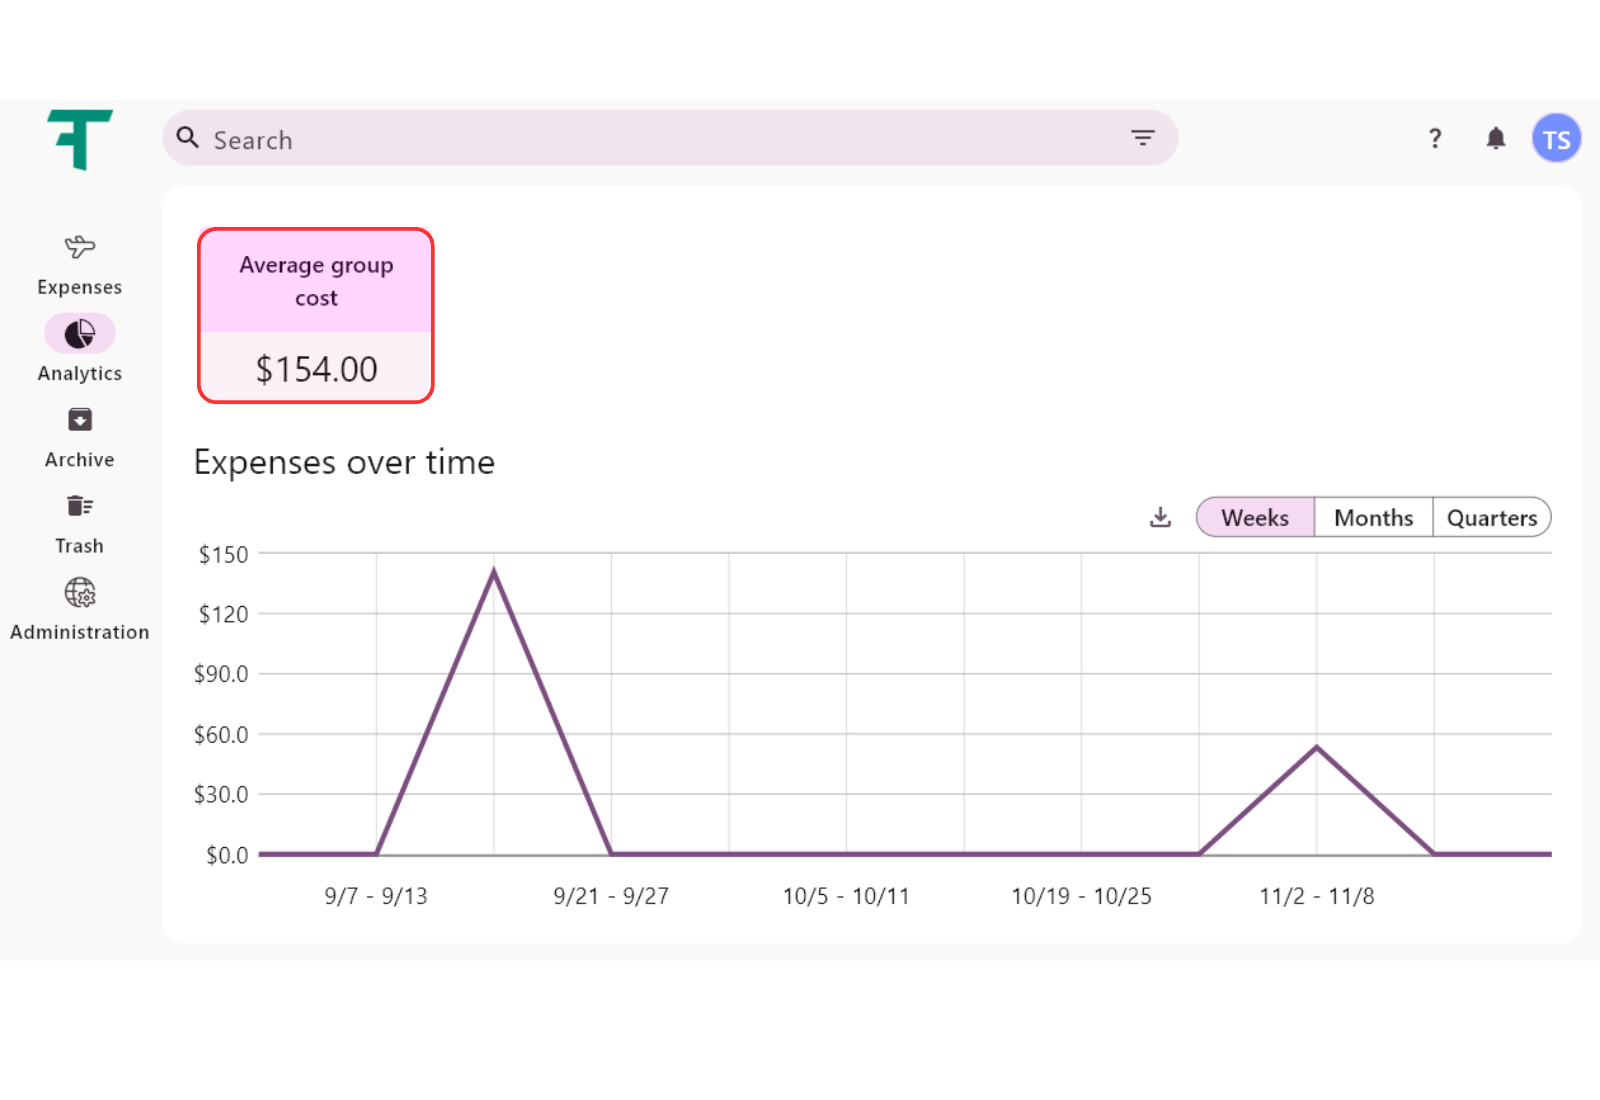
Horní obrazovka sekce Analytika zobrazuje Průměrné náklady skupiny na výdaje.
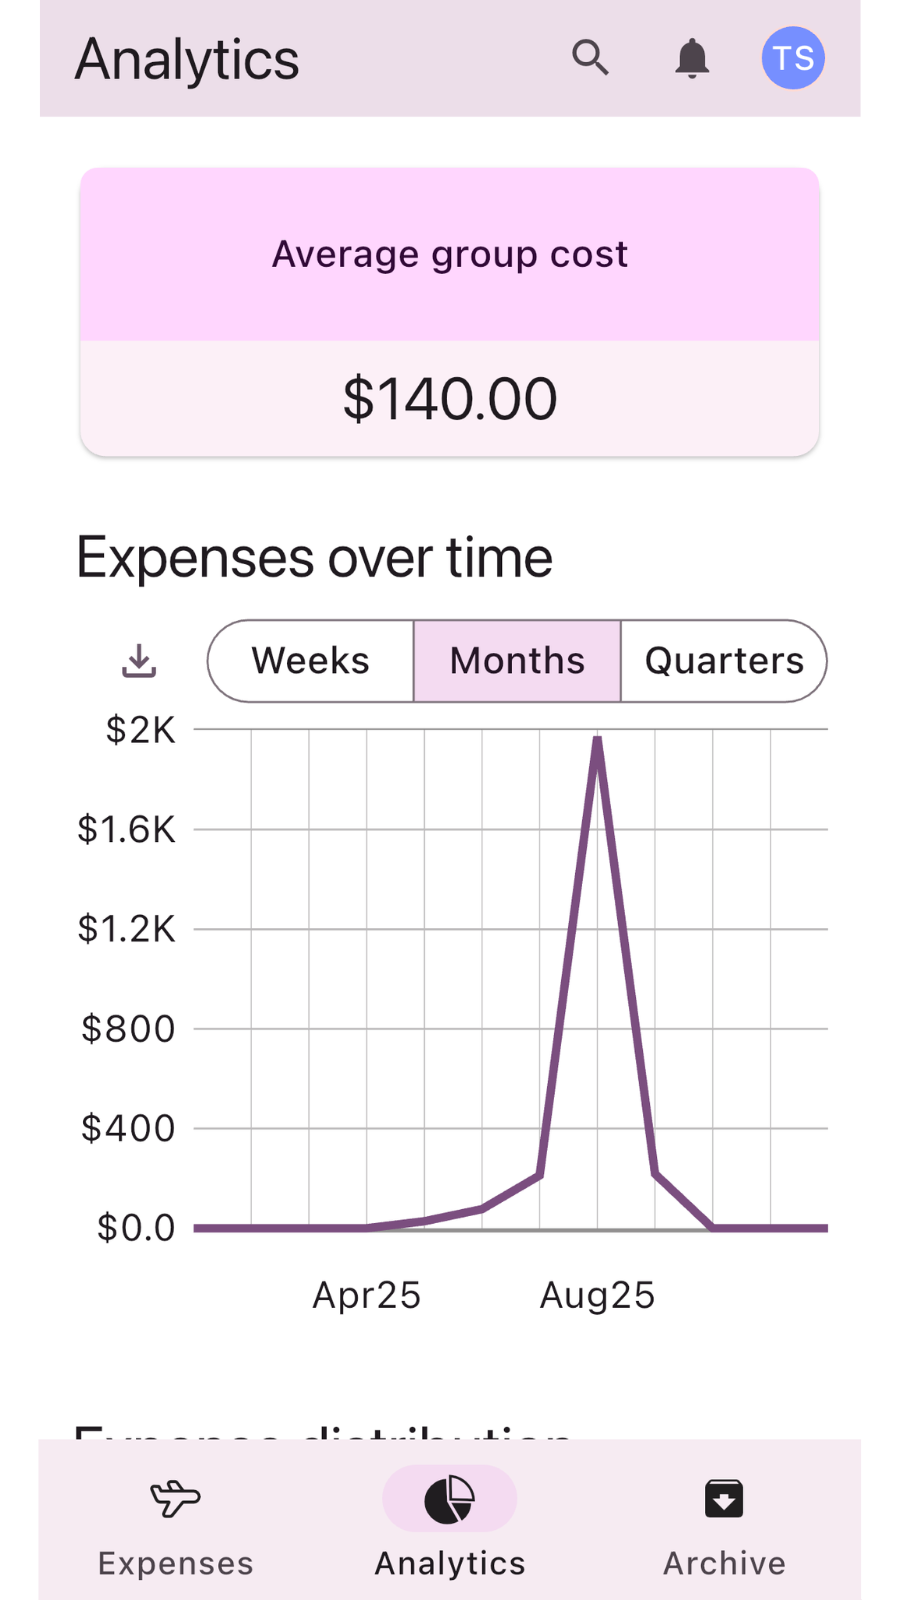
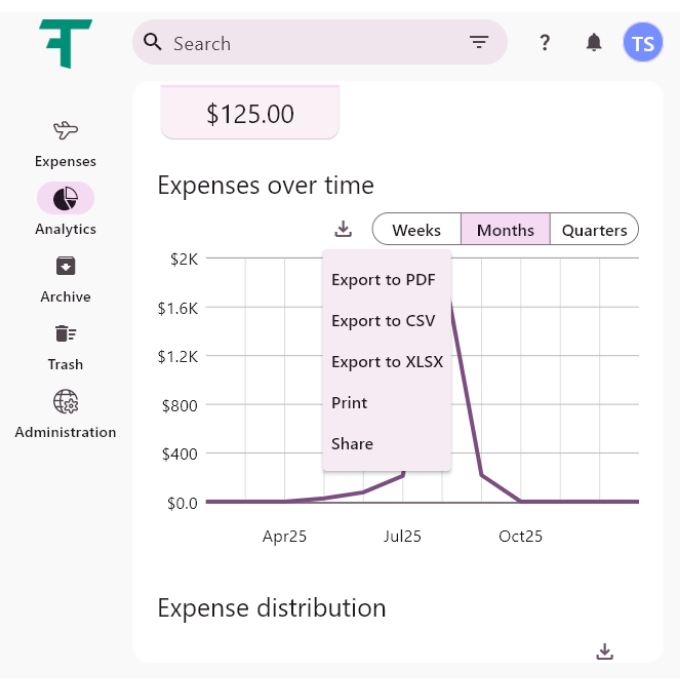
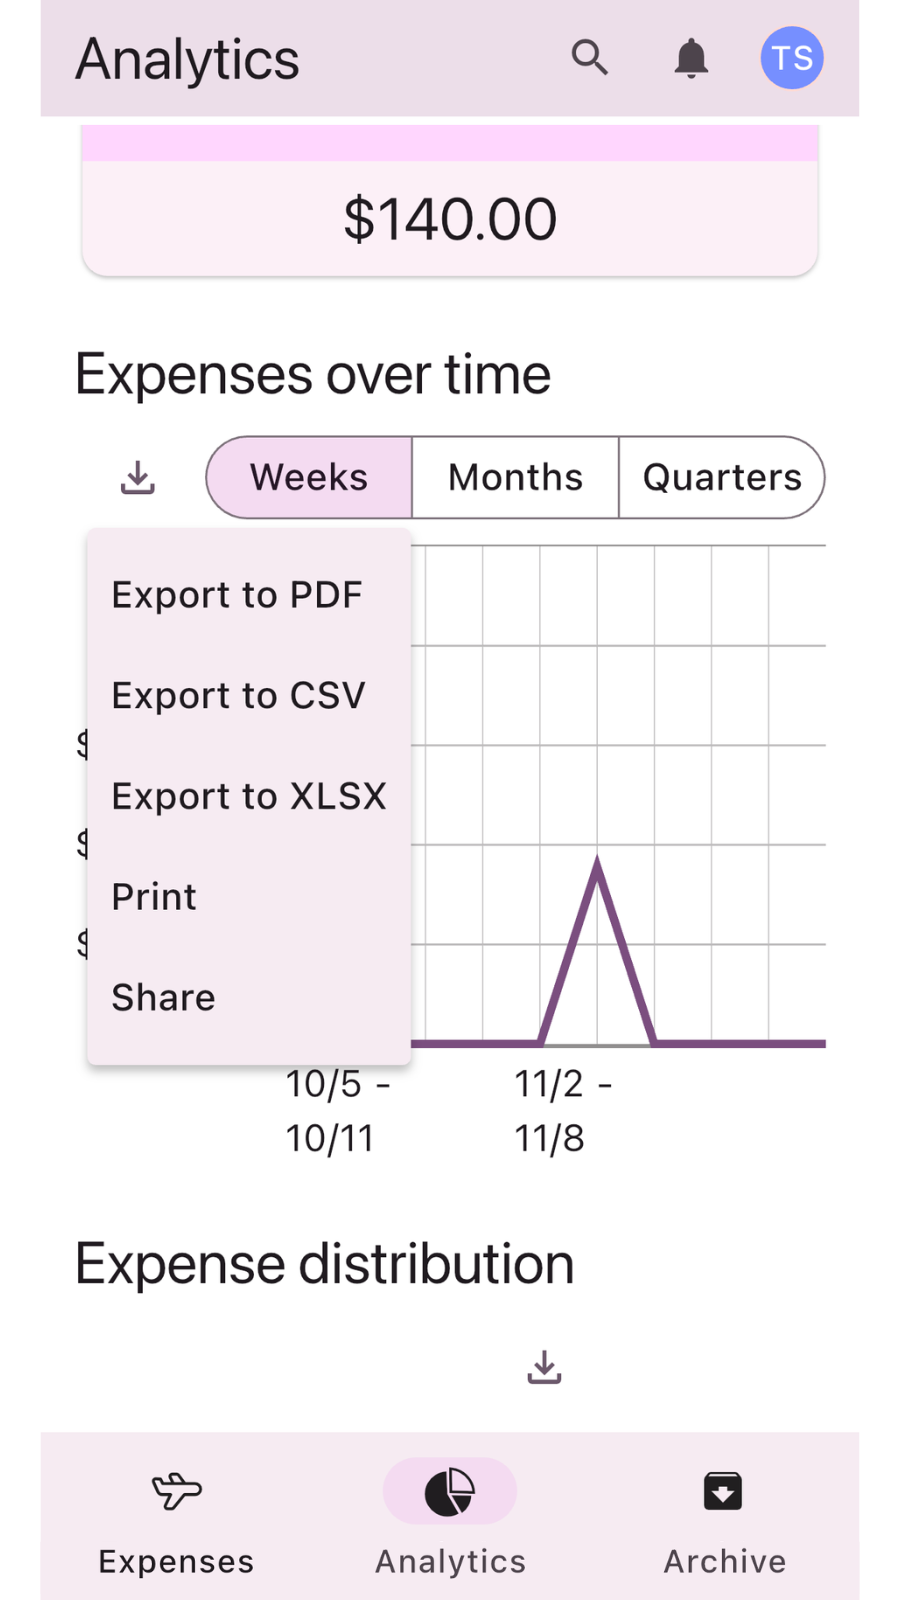
Níže můžete vidět grafy představující různé údaje o výdajích. Na pravé straně nad každým grafem můžete změnit časové období pro zobrazení výdajů za týden, měsíc nebo čtvrtletí. Vedle těchto tlačítek je tlačítko pro export. Graf můžete exportovat do PDF, CSV nebo Excelu, vytisknout ho nebo ihned sdílet.
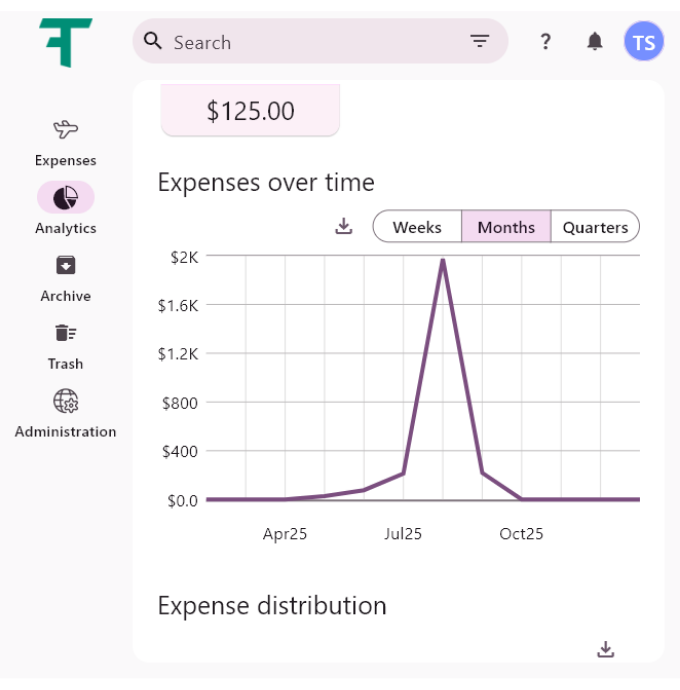
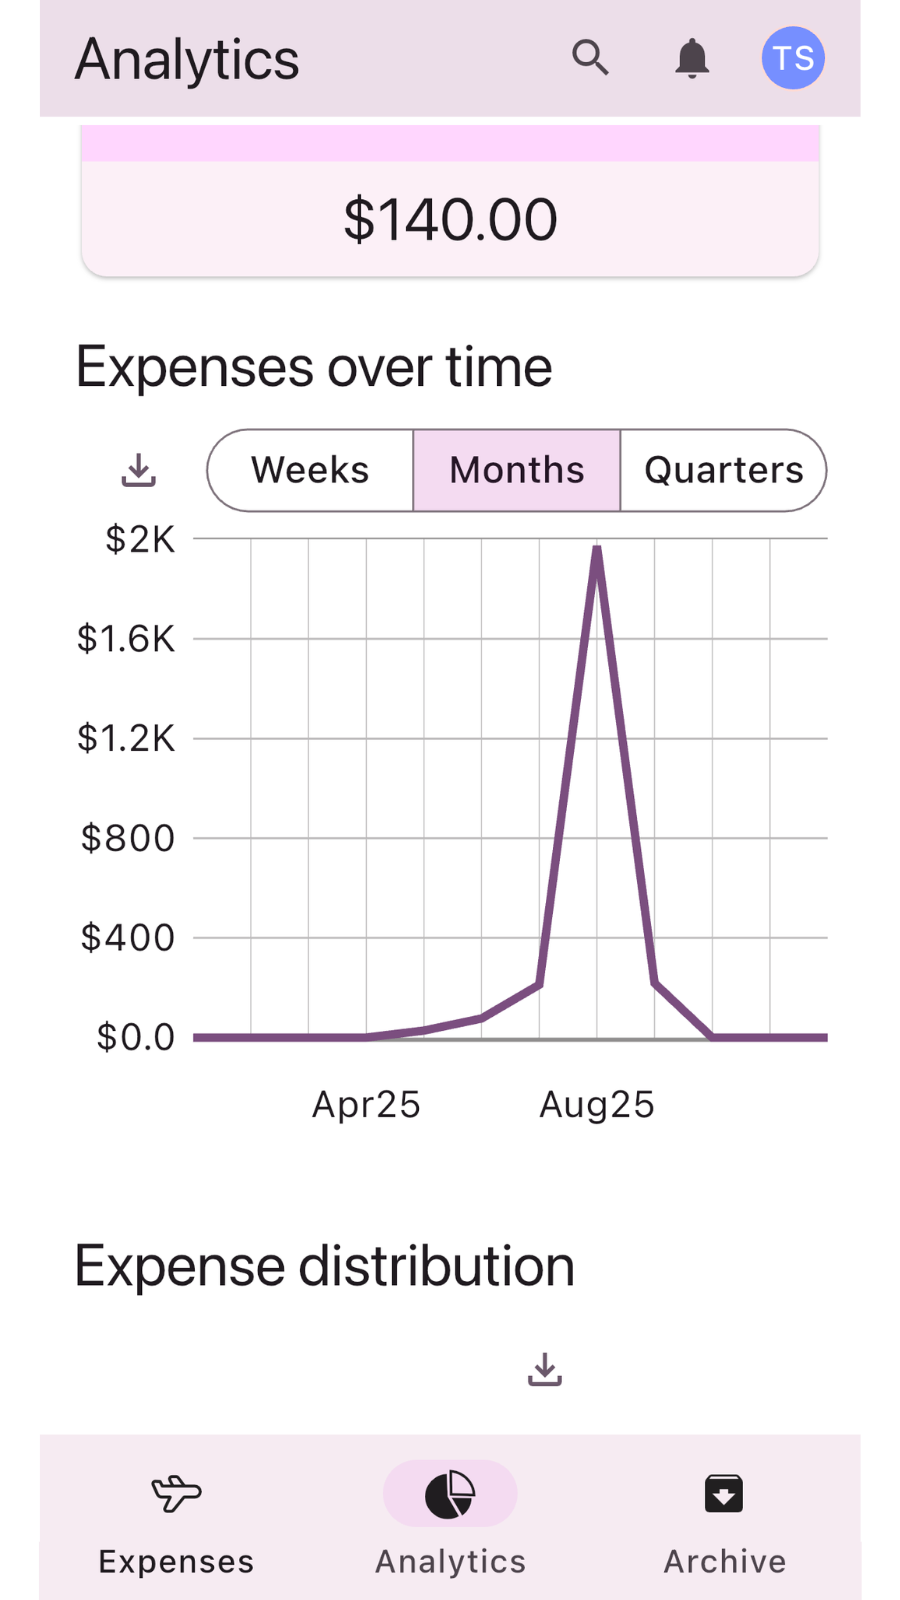
Výdaje v průběhu času
První graf shora je čárový graf představující všechny výdaje v průběhu času.
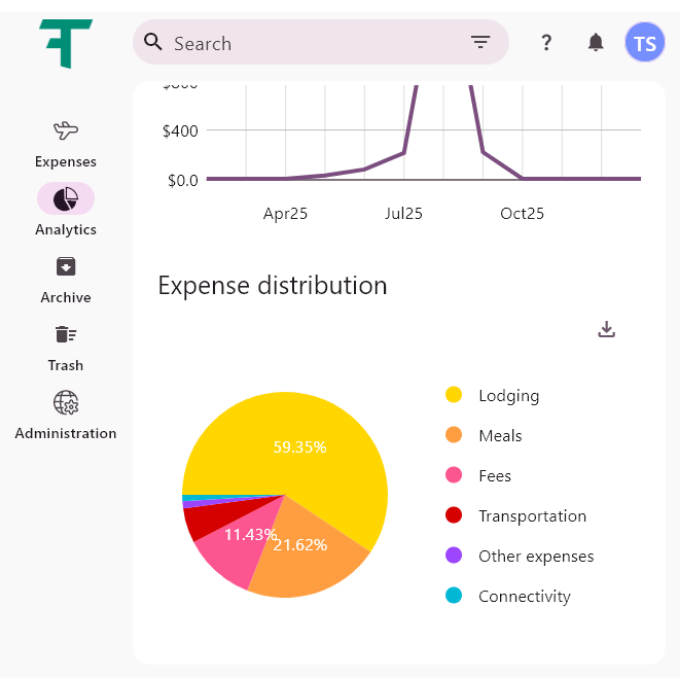
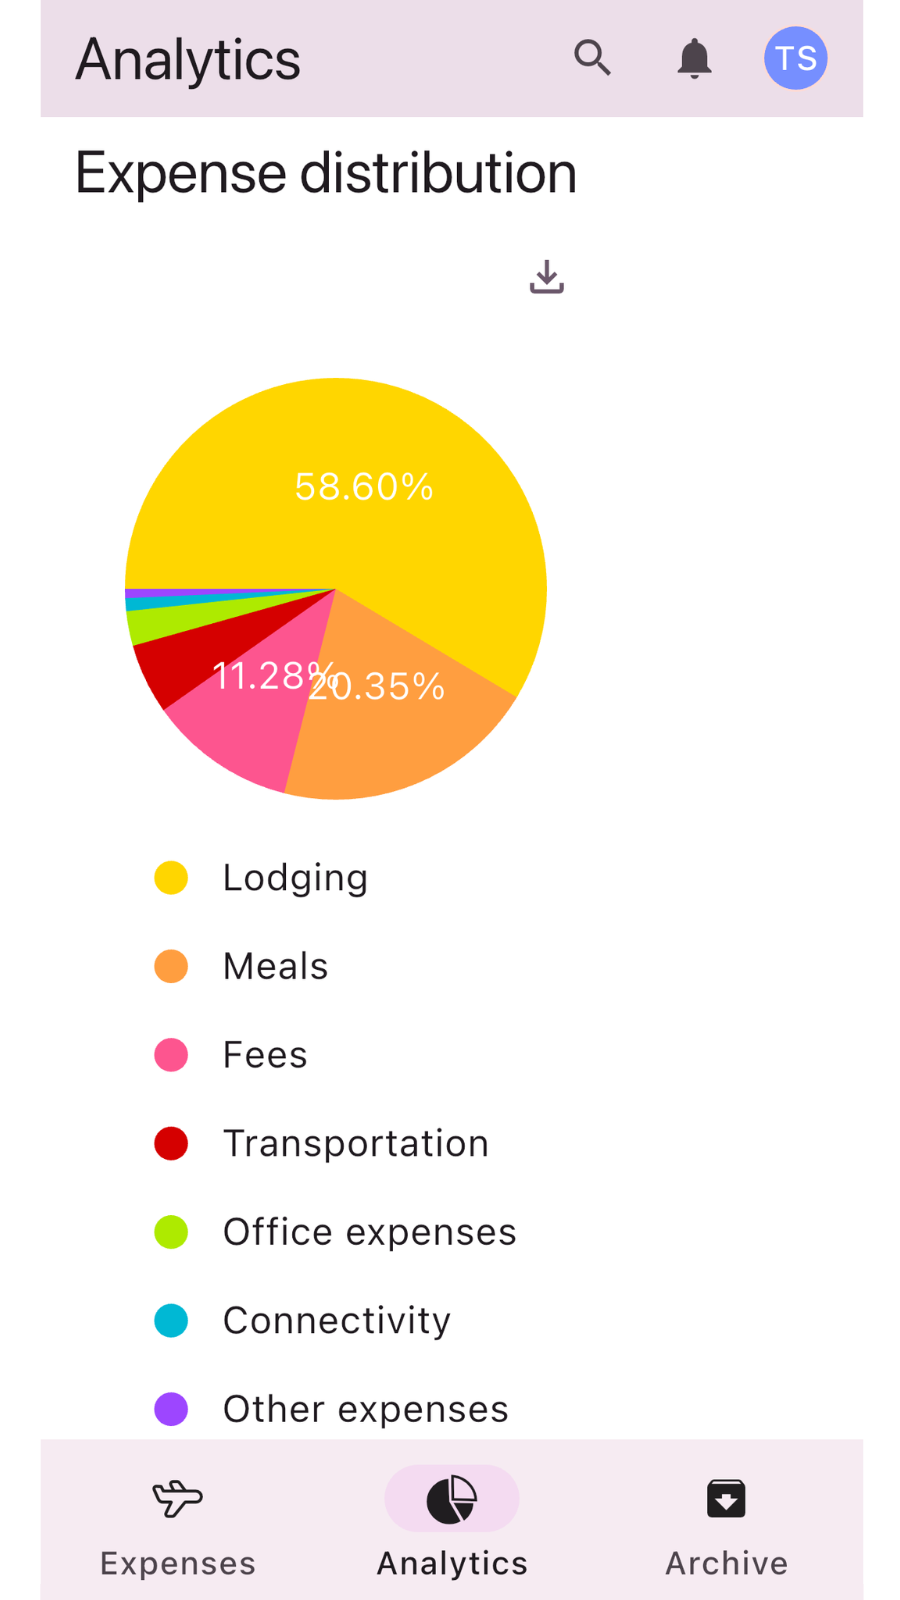
Výdaje podle kategorií
Druhá sekce ukazuje rozložení výdajů mezi všechny kategorie výdajů, které jsou představovány koláčovým grafem.
Související články
Jak smazat svůj účet
Krok za krokem průvodce, jak trvale smazat svůj účet. Zjistěte, co se během procesu děje …
Přečtěte si víceZačínáme
Kickstartujte svou cestu s Traverse pomocí našeho snadno srozumitelného průvodce. Naučte se základy, rychle se …
Přečtěte si víceAdministrace
Spravujte nastavení snadno: přidejte a přizpůsobte měny, kategorie výdajů a platební metody, abyste si přizpůsobili …
Přečtěte si vícePřehled uživatelského rozhraní
Prozkoumejte přehled uživatelského rozhraní, abyste se seznámili s klíčovými funkcemi, navigací a rozvržením. Získejte jasné …
Přečtěte si víceArchivace a mazání výdajů
Naučte se, jak efektivně archivovat své záznamy o výdajích, abyste zajistili bezpečné uložení, snadné vyhledávání …
Přečtěte si vícePřidejte svůj první výdaj
Naučte se, jak rychle a snadno přidat svůj první výdaj pomocí našeho průvodce krok za …
Přečtěte si víceByla tato stránka užitečná?
